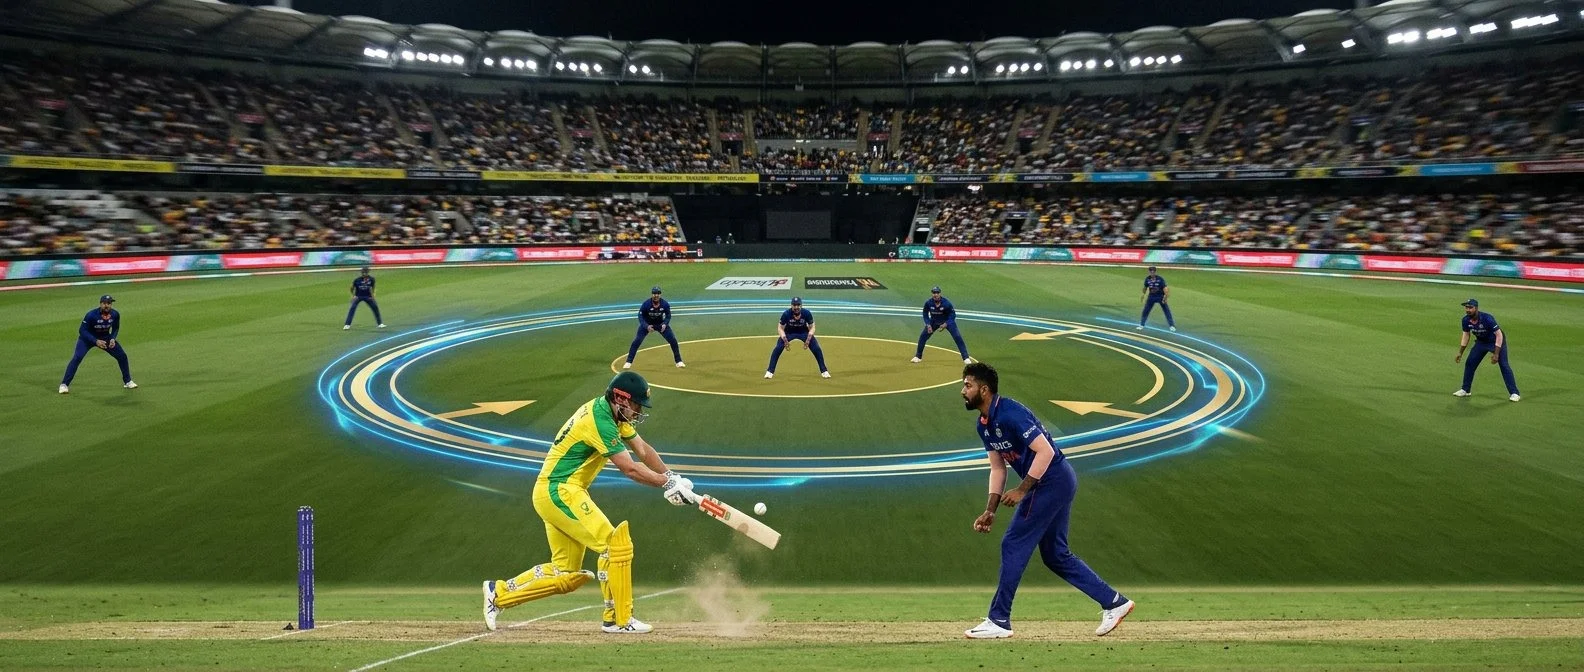

A scoreboard shows a batter has scored 30 from 24 balls. That tells you the scoring rate for the innings so far, but it does not show how the runs were distributed. The batter might have alternated singles and boundaries, or faced a sequence of scoreless deliveries before a short burst of scoring.
A dot-ball count can add detail to the story. It still does not explain every cause, and different sources may define or display the statistic differently. This guide uses fictional examples and is not a prediction or a statement about any particular service's offerings.
Also Read:BBL Betting: What the Designated Batter Rule Means for Team Selection
The Mahadev Book IPL Betting page provides IPL-related information. The official match record and a statistic provider's definition are the starting points for analysing an actual innings.
First ask what “dot ball” means in that dataset
A dot ball is commonly a delivery from which no run is scored, but score providers may report batter dot balls, team dot balls or bowler dot balls using specific conventions. Extras, illegal deliveries and scoring corrections can affect a dataset's count. Read the source's definition before comparing figures.
Do not assume a batter's individual zero-run delivery is automatically identical to a team dot ball. If the team scores an extra without the batter receiving a run, those two questions can produce different answers depending on the definitions used. The official score and the dataset's rules should be checked separately.
An IPL Cricket ID page may discuss cricket accounts; it does not define a statistical provider's dot-ball formula.
Also Read:BBL Betting: How the Power Surge Changes a Two-Over Window
A fictional six-ball example
Imagine six valid balls produce these team runs: 0, 1, 0, 4, 1, 0. Under a simple definition where a team dot is a valid ball producing no team run, there are three dot balls and six runs in the over. The dot-ball percentage is 3 ÷ 6 × 100 = 50%.
This simplified example contains no extras, wickets or corrections. It is designed to show the arithmetic, not to describe a real match. A different dataset may define its denominator or category differently.
If a wide or no-ball is called, it normally does not count as a valid ball in the over under the Laws. A data provider may still include physical deliveries in a separate analysis. Do not divide by six automatically if the statistic's denominator is defined differently.
The Mahadev Book ID Login page concerns account access, not cricket data. For an actual calculation, verify both the numerator and denominator with the source.
The percentage and the count answer different questions
A batter with five dots from ten qualifying balls has a fictional dot percentage of 50%. Another with ten from 20 also has 50%, but the samples have different sizes. One additional dot changes the first percentage more than the second.
A percentage without the underlying number of balls can make a very small sample look more reliable than it is. Always report the count and denominator alongside the percentage where possible. Rounding can also hide a small difference.
A Mahadev Book Login page concerns account access. It does not verify a live statistic or explain which balls a data provider includes.
Why a dot is not automatically a mistake
A scoreless ball can result from a good delivery, a defensive decision, a fielding stop, a missed shot or another event. The scorecard records the result, not the complete reason. In one match situation, protecting a wicket may be valuable; in another, the batting side may need to score rapidly. Avoid treating every dot as the same tactical failure.
Likewise, a bowler can deliver a dot without having executed the intended plan perfectly. A batter may decline a run or a fielder may prevent one. Commentary and footage add context, but they can still be incomplete or subjective.
Boundaries and dots can coexist
Imagine Batter A scores 24 from 12 balls using six fours and six team-dot deliveries, with no extras. Batter B scores 24 from 12 valid balls through a different mix of singles, twos and boundaries. Their totals and rates can match while their ball-by-ball patterns differ.
The example illustrates distribution, not which batter helped the team more. Wickets, match phase, target and fielding conditions matter. A high proportion of dots does not automatically predict a later boundary or dismissal.
A Mahadev Book Registration information page concerns registration rather than scoring. It does not establish a particular market or outcome.
Compare the same phase and format
A six-ball sample in a powerplay should not be treated as identical to a full innings or a sequence at the end of a chase. Fielding restrictions, batters' objectives and opposition can differ. When comparing players, identify the format, match phase, sample size and source definition.
A provider might update a ball-by-ball record after the match. If the dot count changes, check whether a delivery was reclassified, a score was corrected or the denominator changed. Do not accuse a scorer of error solely because a provisional feed differs from a final dataset.
Four questions for a live reader
- Does “dot” mean no team run or no run credited to the batter?
- Are the counted deliveries valid balls, balls faced or all physical deliveries?
- How large is the sample and which phase does it cover?
- Has the source finalised or corrected the record?
The Mahadev App page provides app-related background; it is not an official match-data feed. A website's availability does not establish operator identity or licensing.
Describe the pattern without predicting the next ball
A responsible summary might say, “The batter faced six scoreless team deliveries in this fictional 12-ball sequence.” It should not say a boundary is “due” or a dismissal is inevitable. Cricket deliveries do not follow a guaranteed sequence based on how many dots came before.
Adults who choose to gamble where lawful should set limits and never chase losses. An official statistic and a third-party service's terms are separate; this article does not establish that any particular entry is offered.
Build the numerator before calculating
Suppose a data source explicitly defines a team dot as a valid delivery yielding zero team runs. Review the sequence ball by ball and count only deliveries meeting that definition. Then count the valid balls in the same selected period. The dot percentage is the first count divided by the second, multiplied by 100.
In a fictional 18-valid-ball sample with nine defined team dots, the percentage is 50%. In another sample with 15 dots from 30 valid balls, it is also 50%. The second sample is larger, but neither is enough on its own to establish what would happen in a future match.
The definition must travel with the figure. If another source counts deliveries where the striker received no individual run, it may classify a bye differently from the team-run definition. Neither count should be relabelled as the other without checking the method.
Extras can complicate a ball-by-ball comparison
A bye adds to the team total but not to the batter's individual runs. Under a definition based on no team run, that delivery is not a dot if a bye is scored. Under a batter-focused definition based on no individual run, a provider may treat it differently. Read the source's methodology instead of assuming a universal convention.
A wide ordinarily adds at least a penalty run and does not count as a valid ball in the over. A no-ball also does not count as a valid ball and can be accompanied by other runs. A dataset that counts physical deliveries needs a clearly labelled denominator; one that counts valid balls will handle these events differently.
A scoring correction can alter both the team total and the category assigned to an event. If two sources disagree, check the official scorecard, the timestamp and the definitions before comparing percentages.
A batter's dots are not a team's entire innings
Two batters share an innings. A batter's ball-level record describes deliveries attributed to that batter under the source's conventions; a team-level dot count covers the selected team sequence. Comparing one person's numerator with the entire team's denominator produces a misleading percentage.
Similarly, a bowler's analysis may cover only their own deliveries. A team may score no run from a delivery for a reason involving the batter, bowler or field. The count does not isolate each person's contribution. Use video, fielding information and match context when discussing causes.
If a source publishes a rate without a definition, label the uncertainty or omit the calculation. A precisely formatted percentage is not necessarily meaningful if the underlying categories are unclear.
Consider match state, not just phase names
A powerplay, middle phase and final overs can involve different field restrictions, wickets remaining and objectives. But even within the same phase, two innings can have different targets or match conditions. Comparing dot percentages without those details can create a false impression of similarity.
For a fictional chase, a side that needs a small number of runs from many balls may be able to absorb a scoreless delivery differently from a side needing the same runs from very few balls. The dot count is the same event type; its arithmetic impact on the remaining requirement differs.
In a first innings there is no confirmed chase target yet. A writer can describe the runs and balls recorded without claiming the final total is sufficient. The opposing innings and official result remain future events.
How to check a claim in an article
Find the date, match, player or team, phase and data provider. Confirm what the provider counts as a dot and which balls form the denominator. Recalculate the percentage from the counts, allowing for rounding. Check whether the record is live or final.
Avoid causal claims such as “the field alone created every dot” unless there is evidence for each event. A fielding stop, a defensive shot and a missed shot can all produce no run, but they are not the same action. A thoughtful match report can describe the pattern while acknowledging that a simple statistic cannot explain every delivery.
A second worked sequence: team runs versus batter runs
Imagine six valid deliveries produce this fictional team sequence: dot, bye, single, dot, two runs from the bat, dot. Team runs total four and, under the simple definition of a team dot as a valid ball with no team run, there are three team dots. The bye adds one to the team total even though it is not credited as an individual batter run.
A batter-focused source may display a different count depending on how it defines and attributes balls faced, changes of strike and extras. Do not infer that count solely by subtracting boundaries from the team total. The provider's methodology and actual striker on each ball are necessary.
The example assumes no illegal deliveries or wickets. If the official scorer corrects a bye to bat runs, the team total can remain the same while an individual statistic changes. That is another reason to identify which record is being analysed.
Why scoreless deliveries do not add up to a forecast
A sequence of dots changes the match state because valid balls have been used without adding team runs under the selected definition. It does not create a rule that a boundary must follow. Each later delivery remains an uncertain sporting event influenced by many factors.
A player may respond to a quiet period with a change in shot selection, while the fielding side may change the field or bowler. Those are possible observations, not certain consequences. A responsible description records what happened and avoids language implying an outcome is “due.”
This distinction also matters for personal decisions. Trying to recover losses because a boundary or wicket appears overdue can increase harm. A statistic is not a guarantee, and a time or spending limit should not be extended to chase a particular result.
A table of fictional counts
|
Defined team dots |
Valid balls in selected sample |
Dot percentage |
|
3 |
6 |
50% |
|
6 |
12 |
50% |
|
7 |
12 |
approximately 58.33% |
|
12 |
24 |
50% |
The rows share a definition but not a sample size. A one-ball correction affects a six-ball sample much more than a 24-ball sample. A rate calculated from a short sequence should be labelled as such.
Compare like with like
Before comparing two batters, check that the source measures the same type of dot, the same format and a comparable period. A batter's entire innings and another batter's final-over sample are not equivalent. A team rate and a bowler-specific rate may also use different denominators.
The match situation remains important even when the formula is identical. Wickets remaining, the target, fielding restrictions and conditions can differ. These factors do not automatically tell you which batter performed better, but they explain why the same percentage can arise in different circumstances.
Verify a live feed against the final record
Live score providers can correct a run type, change the striker attribution or update a delivery's validity. Note the time of the display and whether the source labels the data provisional. When the official record is final, recalculate using the corrected count and denominator.
If a provider does not explain its method, ask or omit the comparison. A statistic is useful only if readers can understand what it measures. A precise-looking percentage derived from an uncertain definition can mislead more than a simple description of the recorded sequence.
A note on strike rate and scoring distribution
Batting strike rate normally expresses runs credited to the batter per 100 balls faced. A dot percentage can describe the distribution of scoreless events under a specified definition. The two measures are related to scoring, but they are not interchangeable and may use different source conventions.
For example, a fictional batter scores 24 runs from 12 balls faced, giving a strike rate of 200. That number alone does not tell you how many of the 12 balls produced a team run, how many were dots under the provider's definition or whether the batter was dismissed. You need the underlying sequence and the relevant definitions.
A high strike rate in a tiny sample can change dramatically after one more delivery. A dot count can also change sharply after a correction. Report the number of balls with both figures and avoid treating either as a promise about the next over.
Official Regulatory & Industry References
Mahadev Book adheres to industry compliance, fair play principles, and statutory regulatory standards: